The Box Office Sales report gives event organizers a real-time, comprehensive view of all ticket sales revenue across every sales channel including online, cash, card, and more. Use this report to monitor performance, track individual user activity, and export data for accounting or analysis.
Frequently Asked Questions
What is the Box Office Sales report?
The Box Office Sales report is a dedicated reporting module inside FEARTICKET that displays your event's ticket sales data broken down by date or user (cashier/box office operator). It shows revenue collected via different payment methods including Cash, Card, Card Offline, Check, and Refunds, along with the Gross Revenue for each transaction period.
To access it, go to Reports in the left-hand sidebar and click Box Office Sales.
How often is the data refreshed?
For performance, results are refreshed from cache every 5 minutes. The data you see may be up to 5 minutes behind real-time activity. If you need the most current snapshot, wait a few minutes and reload the page.
How do I filter the Box Office Sales report?
The report provides three filter options at the top of the page:
| Filter | Description | Default |
|---|---|---|
| Date Range | Select a custom start and end date/time to narrow results to a specific period. | All available dates |
| User | Filter results by a specific box office user or cashier. | All Users |
| Device | Filter results by a specific point-of-sale device. | All Devices |
After setting your filters, click the red Search button to apply them. Click Reset to clear all filters and return to the default view.
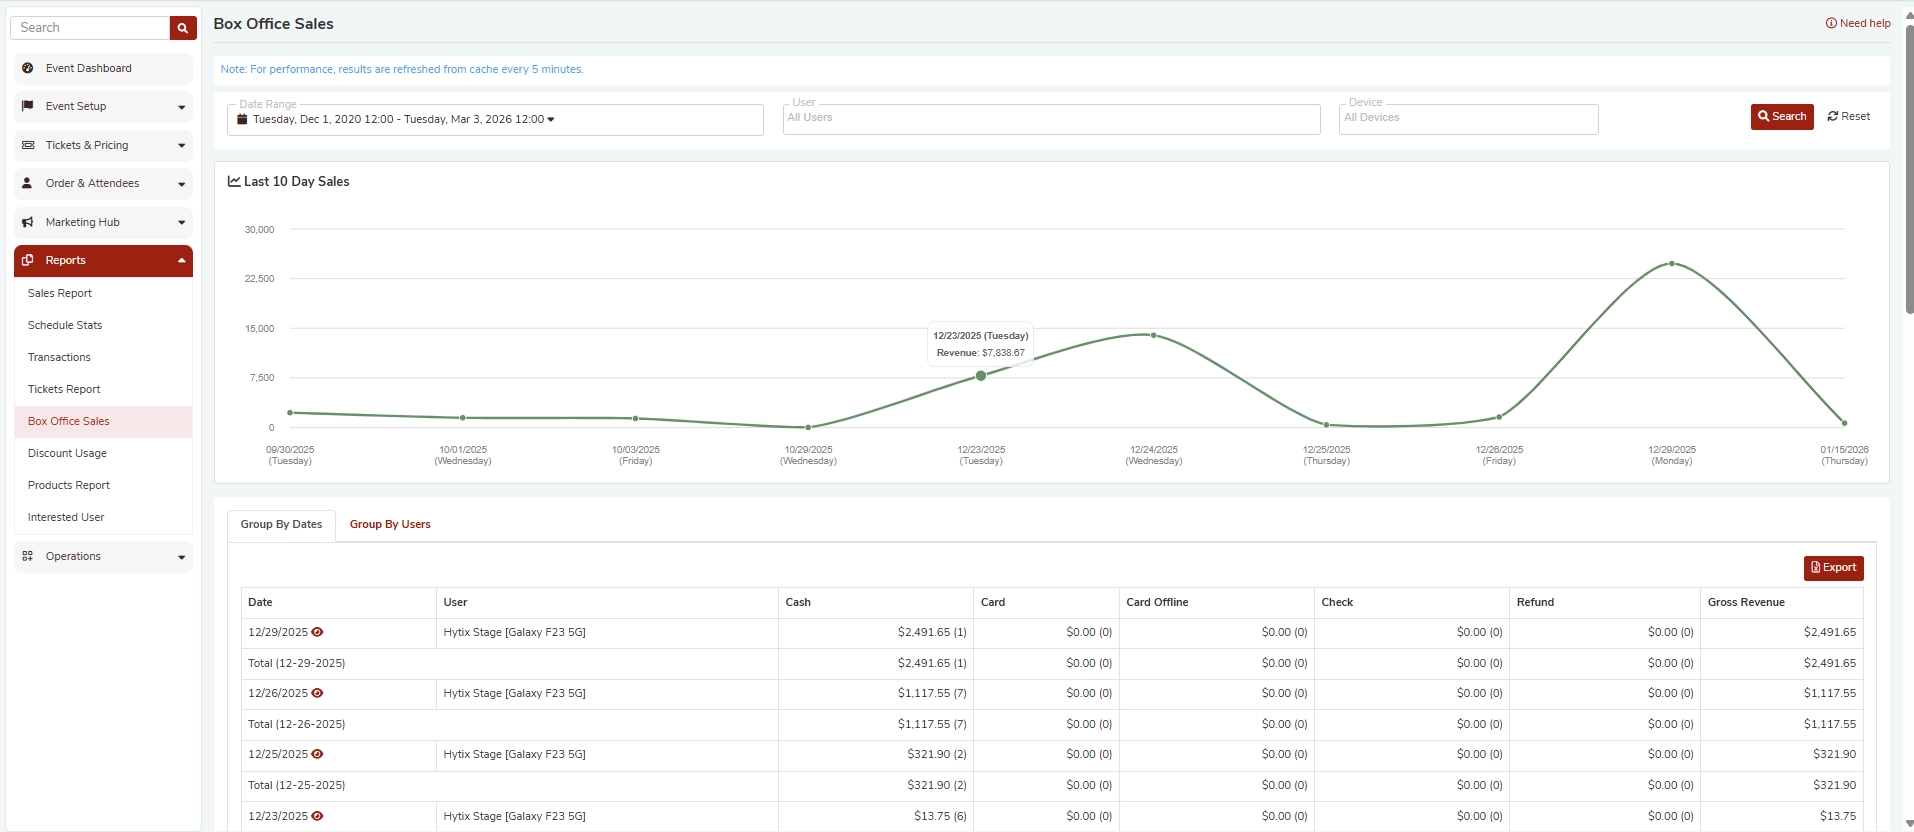
What does the Last 10 Day Sales chart show?
The line chart at the top of the report visualizes your daily gross revenue over the last 10 days within your selected date range.
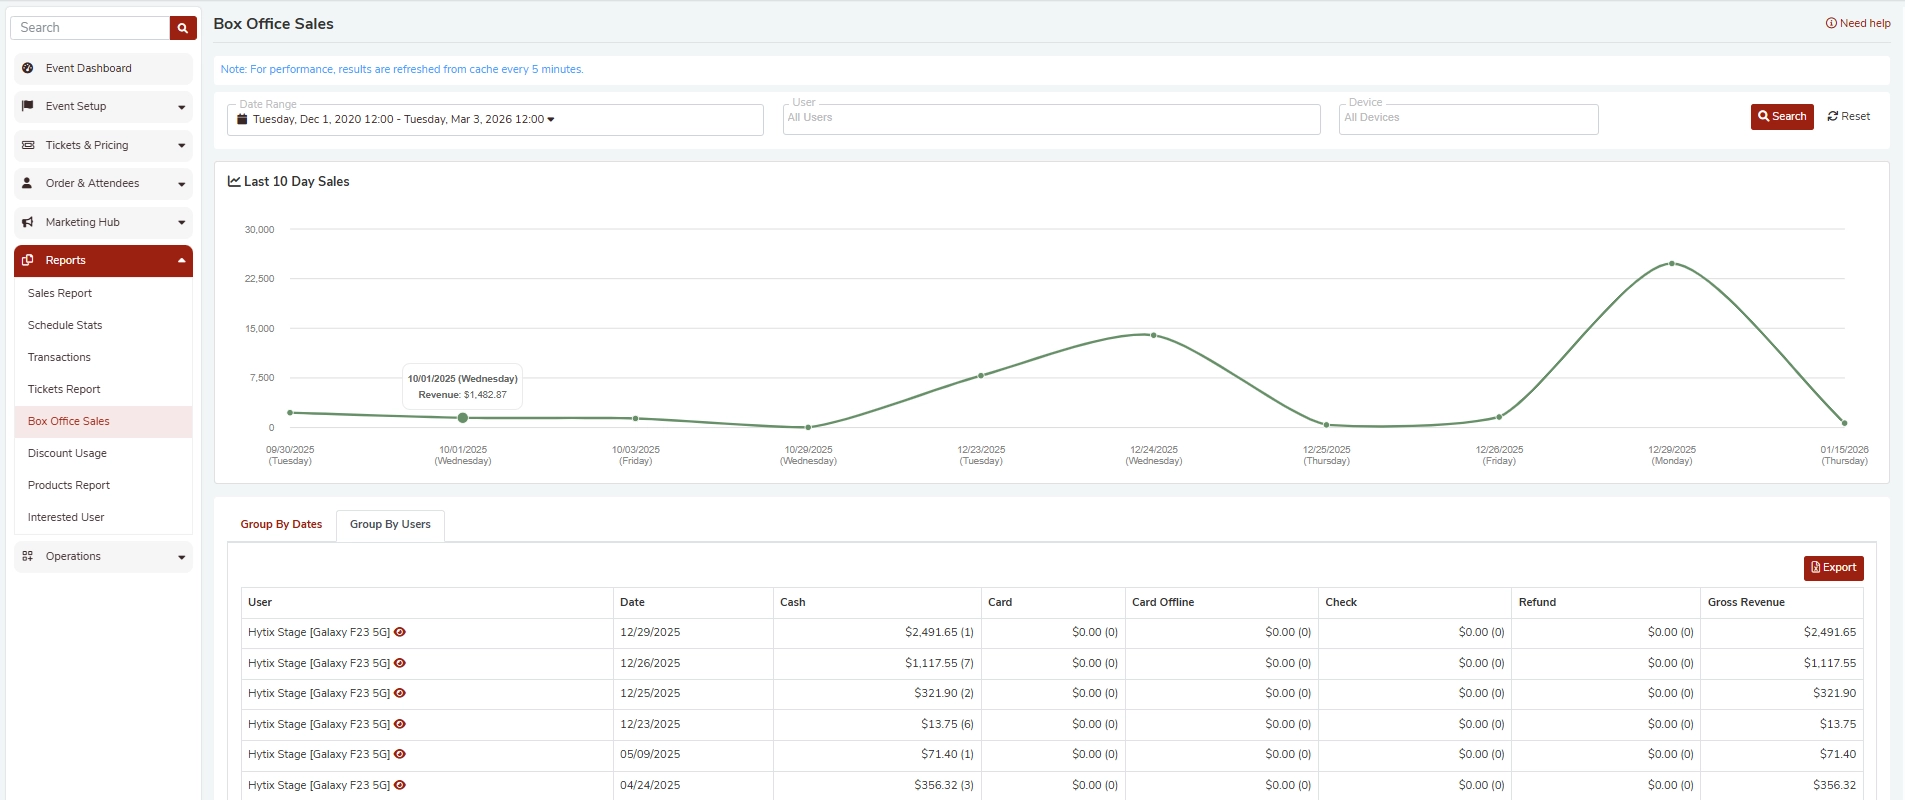
Hovering over any data point on the chart will display a tooltip showing:
- The date and day of the week
- The total revenue for that day
This gives you a quick visual overview of your sales trend over time.
What is the difference between Group By Dates and Group By Users?
The report table can be viewed in two modes using the tabs below the chart:
Group By Dates
Organizes all sales transactions chronologically by date. Each date shows individual transaction rows along with a daily subtotal row (for example, Total 12-29-2025). This view is best for reviewing daily performance and reconciling end-of-day totals.
Group By Users
Organizes sales by the box office user or cashier who processed each transaction. The table displays columns for User, Date, Cash, Card, Card Offline, Check, Refund, and Gross Revenue. Each user row shows all the dates they made sales on, along with the revenue broken down by payment method.
This view is best for:
- Reviewing individual staff or cashier performance
- Reconciling end-of-shift reports
- Identifying which device or operator handled specific transactions
What payment method columns are shown in the report?
Each row in the report breaks down revenue into the following columns:
| Column | Description |
|---|---|
| Cash | Revenue collected in cash at the box office. The number in parentheses shows the ticket count. |
| Card | Revenue from credit or debit card payments processed online or at the box office. |
| Card Offline | Card payments processed while the device was offline and synced later. |
| Check | Revenue from check payments. |
| Refund | Total refunded amounts for the period. |
| Gross Revenue | Total revenue across all payment methods after refunds for that row or period. |
The number in parentheses next to each dollar amount (for example, $2,491.65 (1)) represents the number of tickets sold via that payment method.
What does the User column show in the Group By Users view?
In the Group By Users view, the User column displays the name of the box office operator or device that processed the sale (for example, Hytix Stage [Galaxy F23 5G]). Each user entry lists all the individual transaction dates and the corresponding revenue breakdown.
This helps you:
- Identify which staff member or terminal handled each sale
- Audit device-level performance
- Troubleshoot discrepancies at the user or device level
Can I export the Box Office Sales data?
Yes. Click the red Export button in the top-right corner of the report table to download the data. This is useful for:
- Sharing reports with your accounting team
- Archiving sales records
- Importing into spreadsheet tools for further analysis
How do I read the daily subtotal rows?
In the Group By Dates view, rows labeled Total (MM-DD-YYYY) are aggregated subtotals for all transactions on that calendar date. These summary rows let you see the full revenue picture for each day without manually adding up individual entries.
Why do some payment method cells show $0.00 (0)?
A value of $0.00 (0) means no transactions were processed via that payment method for that specific row or date. For example, if all sales on a given day were cash only, the Card, Card Offline, and Check columns will all show $0.00 (0).
Who can access the Box Office Sales report?
Access is available to event organizers and staff accounts with Reports permissions enabled in FEARTICKET. If you cannot see the Reports section in your sidebar, contact your account administrator to update your access level.
Pro Tip: Use the Group By Users view at the end of each event night to quickly reconcile each cashier's sales and confirm that cash drawers match the reported totals.
Was this article helpful?
That’s Great!
Thank you for your feedback
Sorry! We couldn't be helpful
Thank you for your feedback
Feedback sent
We appreciate your effort and will try to fix the article