FEARTICKET shows you how your coupon codes are performing in the Discount Usage Report. It breaks usage down by coupon code, ticket, product, and day, pairs the key sections with charts, and ends with an order-by-order list of every discounted purchase. This makes it the place to track how much each promotion is costing and earning. This article walks through the page and its filters.
To open it, go to Reports in the left-hand menu of your event and click Discount Usage. A note reminds you that results are refreshed from cache every 5 minutes, so recent activity may take a few minutes to appear.
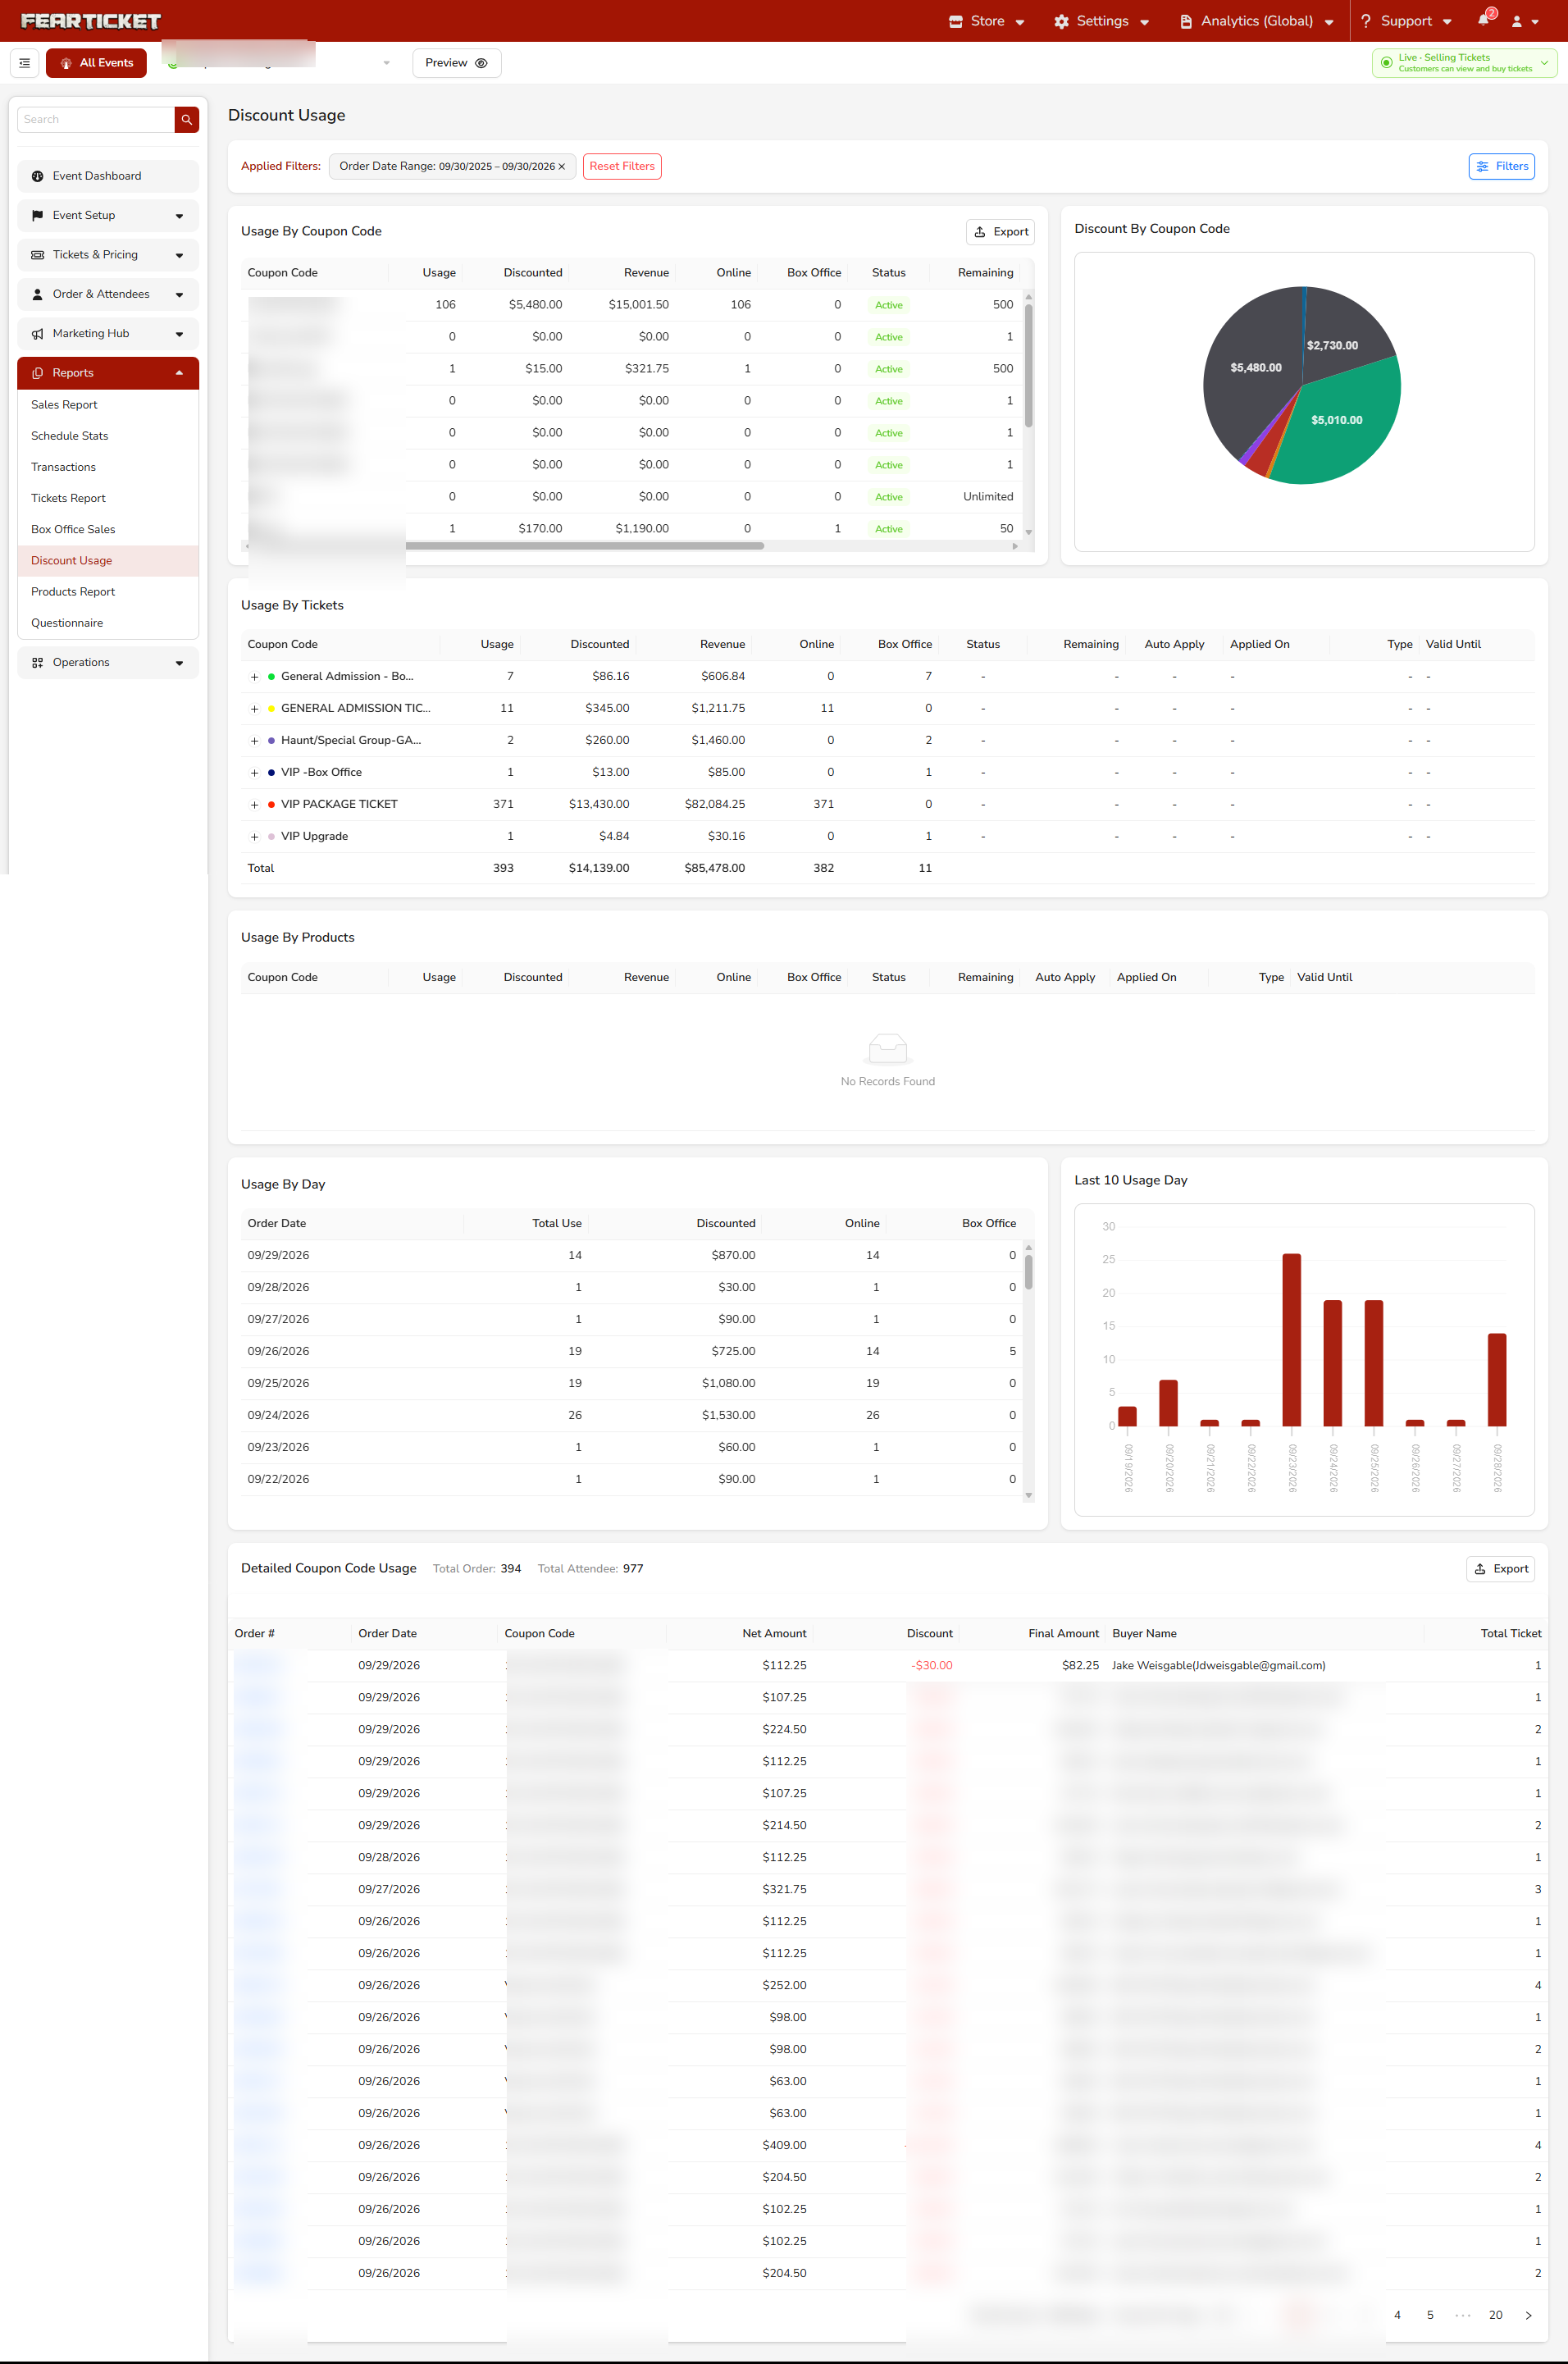
Filtering the Report
At the top, Applied Filters shows the active filters as removable chips, with a Reset Filters link and a Filters button. The Filters window is where you set the Order Date Range. You can type a start and end date or use the calendar with quick presets such as Today, Yesterday, Last 7 Days, Last 30 Days, This Month, Last Month, or a Custom Range. Click Apply to update the report.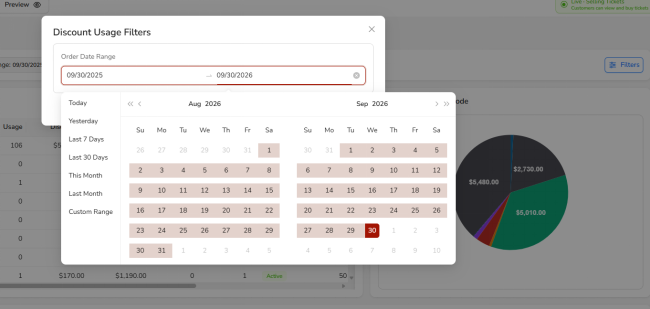
Usage By Coupon Code
The Usage By Coupon Code table lists every coupon code with its performance, and a Total row at the bottom. Beside it, the Discount By Coupon Code pie chart shows how the total discount amount splits across your codes. The columns are:
Column | What It Shows |
Coupon Code | The name of the discount code |
Usage | How many times the code was used |
Discounted | Total dollar amount discounted |
Revenue | Total revenue from orders using the code |
Online | Uses through the online portal |
Box Office | Uses at the box office |
Status | Whether the code is Active or Inactive |
Remaining | Uses left, or Unlimited if there's no cap |
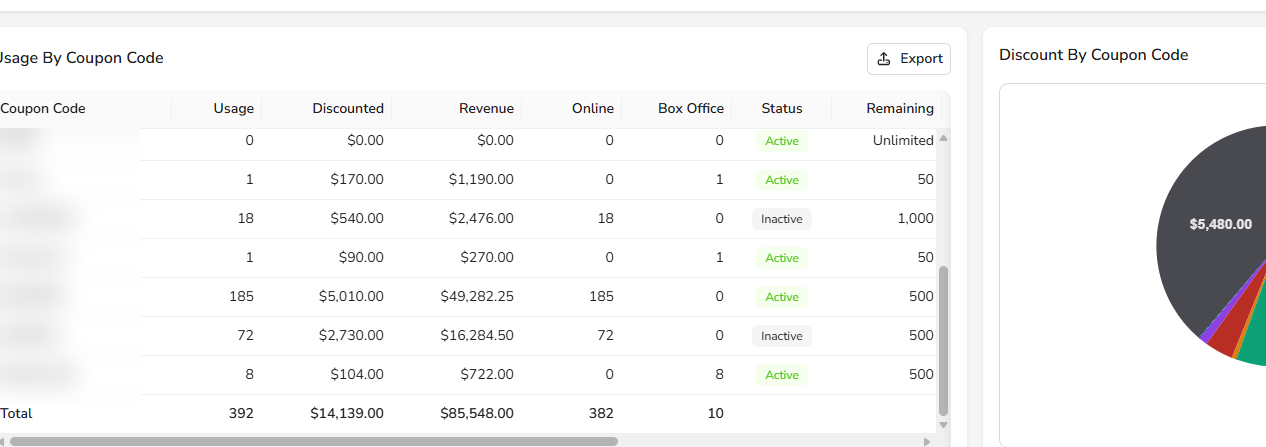
A green Active badge means the code is currently usable, and a grey Inactive badge means it isn't.
Usage By Tickets and Usage By Products
The Usage By Tickets section breaks coupon usage down to the ticket type level. Each ticket type is an expandable row, so you can click it to see which codes were used on that ticket, along with the same usage, discount, and revenue figures. The Usage By Products section does the same for add-on products sold alongside tickets, and shows no records when no product discounts apply.
Usage By Day
The Usage By Day table gives a day-by-day breakdown of coupon activity, showing the total uses, discount amount, and the online and box office split for each date. The Last 10 Usage Day bar chart beside it highlights the days with the most discount activity, which often line up with a promotion or a widely shared code.
Detailed Coupon Code Usage
The Detailed Coupon Code Usage table at the bottom is the most granular view: one row for every order where a discount was applied. Its header also shows the Total Order and Total Attendee counts for the filtered range. The columns are:
Column | What It Shows |
Order # | The order the discount was applied to |
Order Date | When the order was placed |
Coupon Code | Which code was used, with its value |
Net Amount | The order value before the discount |
Discount | The amount taken off |
Final Amount | What the buyer actually paid |
Buyer Name | The name and email on the order |
Total Ticket | Number of tickets on the order |
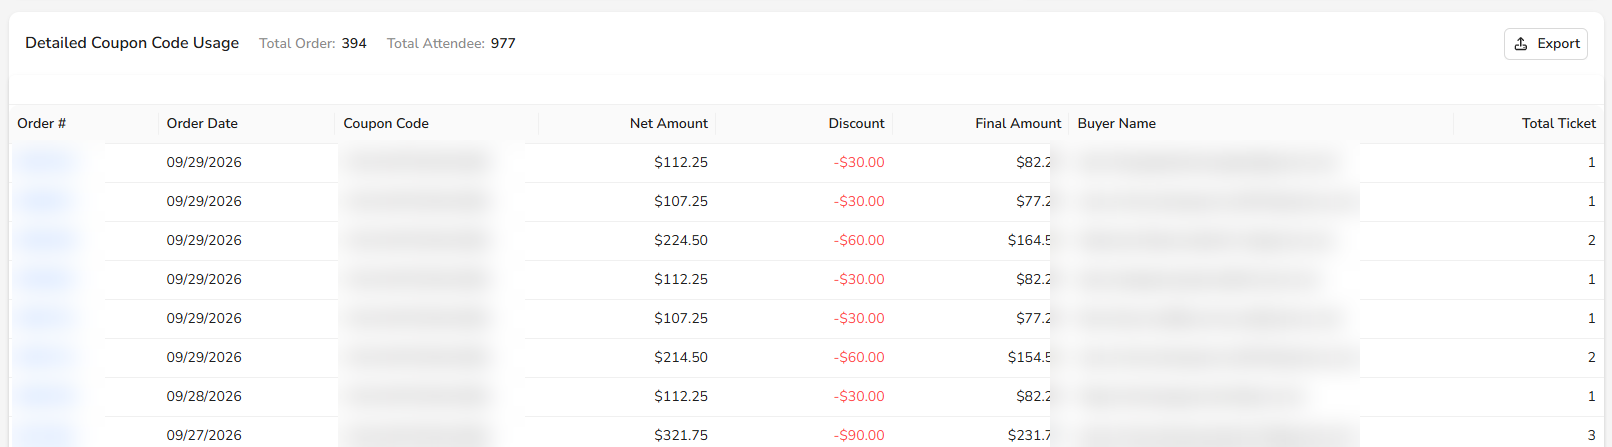
A Final Amount of $0.00 means the code gave a 100% discount, making the order free for the buyer, which is common with comp codes and staff passes.
Exporting the Report
The Usage By Coupon Code and Detailed Coupon Code Usage sections each have their own Export button in the top-right corner, so you can download that section's data for offline analysis or record-keeping. The export reflects the current filters.
Note: The Detailed Coupon Code Usage section includes buyer names and email addresses. Handle that data in line with your privacy and data-protection responsibilities. The report is also cached and refreshes every 5 minutes, so recent usage may take a short while to appear.
Was this article helpful?
That’s Great!
Thank you for your feedback
Sorry! We couldn't be helpful
Thank you for your feedback
Feedback sent
We appreciate your effort and will try to fix the article