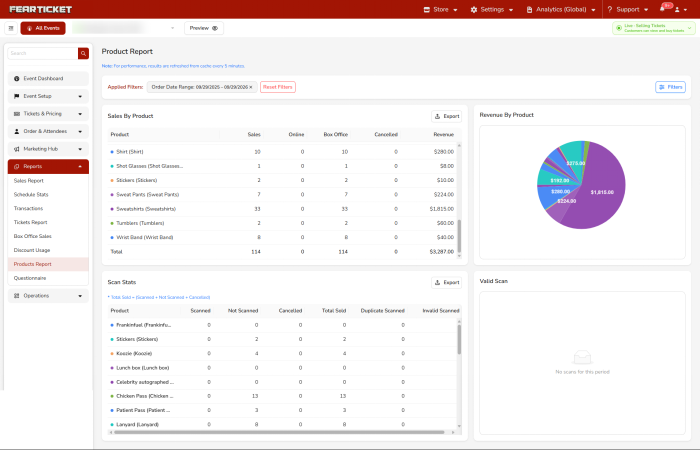
FEARTICKET shows you how your products are performing in the Products Report. It summarizes sales volume, revenue, selling channel, and scan activity, pairing the key sections with charts so you can read the numbers and see the split at a glance. This is useful for comparing products, tracking revenue, and reviewing check-in performance. This article walks through the page and its filters.
To open it, go to Reports in the left-hand menu of your event and click Products Report. A note at the top reminds you that results are refreshed from cache every 5 minutes, so recent sales may take a few minutes to appear.
Filtering the Report
At the top, Applied Filters shows the active filters as removable chips, with a Reset Filters link and a Filters button that opens the filter window.
Order Date Range
Set the period the report covers. You can type a start and end date or use the calendar with quick presets such as Today, Yesterday, Last 7 Days, Last 30 Days, This Month, Last Month, or a Custom Range. If your numbers look low or empty, it's usually worth checking the date range first.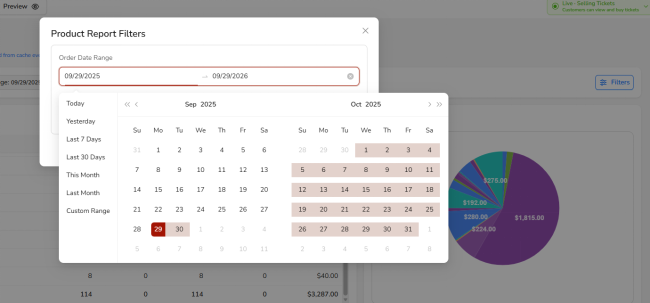
Selling Point
Filter by where the product was sold. All Channels shows everything, or you can narrow it to just Online or just Box Office.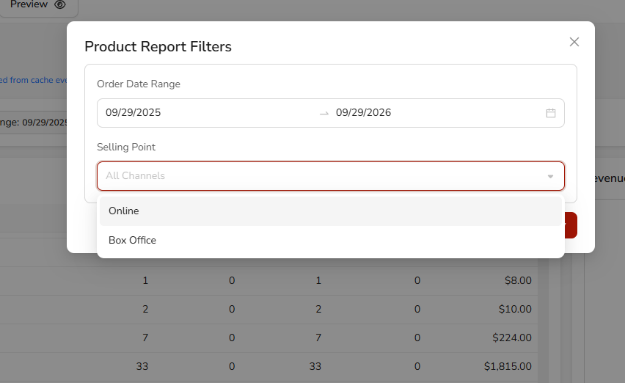
After setting the filters, click Apply to update the report, or Reset to clear them.
Sales By Product
The Sales By Product table breaks down performance by individual product, with a Total row at the bottom. Beside it, the Revenue By Product pie chart shows each product's share of revenue. The columns are:
Column | What It Shows |
Product | The name of the product |
Sales | Total number of units sold |
Online | Units sold through the online portal |
Box Office | Units sold at the box office |
Cancelled | Cancelled units, if any |
Revenue | Total revenue for that product in the selected range |
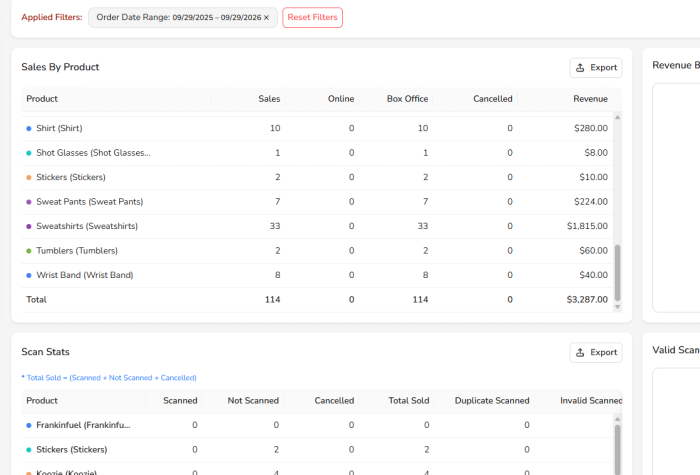
In most cases Sales matches Online plus Box Office. If it doesn't, look for refunded or cancelled units in the range.
Scan Stats
The Scan Stats table shows check-in and scanning activity for each product, which is useful for monitoring the gate during your event. The Valid Scan pie chart beside it visualizes successful scans, and shows an empty state when there are no scans for the period. Note that Total Sold equals Scanned plus Not Scanned plus Cancelled. The columns are:
Column | What It Shows |
Product | The product being scanned |
Scanned | Units successfully scanned or checked in |
Not Scanned | Units sold but not yet scanned |
Cancelled | Cancelled units |
Total Sold | Total sold (Scanned + Not Scanned + Cancelled) |
Duplicate Scanned | Units scanned more than once |
Invalid Scanned | Scan attempts that did not validate |
Keep an eye on Duplicate Scanned and Invalid Scanned to catch repeat scans or failed scan attempts at the gate.
Exporting the Report
The Sales By Product and Scan Stats sections each have their own Export button in the top-right corner, so you can download that section's data on its own for sharing or bookkeeping. The export is a spreadsheet-friendly file and reflects the current filters.
Note: The report is cached and refreshes every 5 minutes, so the newest sales and scans may take a short while to appear. If a Valid Scan panel shows no data, confirm that check-ins happened within the selected date range, then reload after a few minutes.
Was this article helpful?
That’s Great!
Thank you for your feedback
Sorry! We couldn't be helpful
Thank you for your feedback
Feedback sent
We appreciate your effort and will try to fix the article